Free · Live · One-time-only special briefing
See the Complete Dark Ticker Record
Thursday, October 15 · 2 PM ET
Free to attend · No replay · Access details sent by email
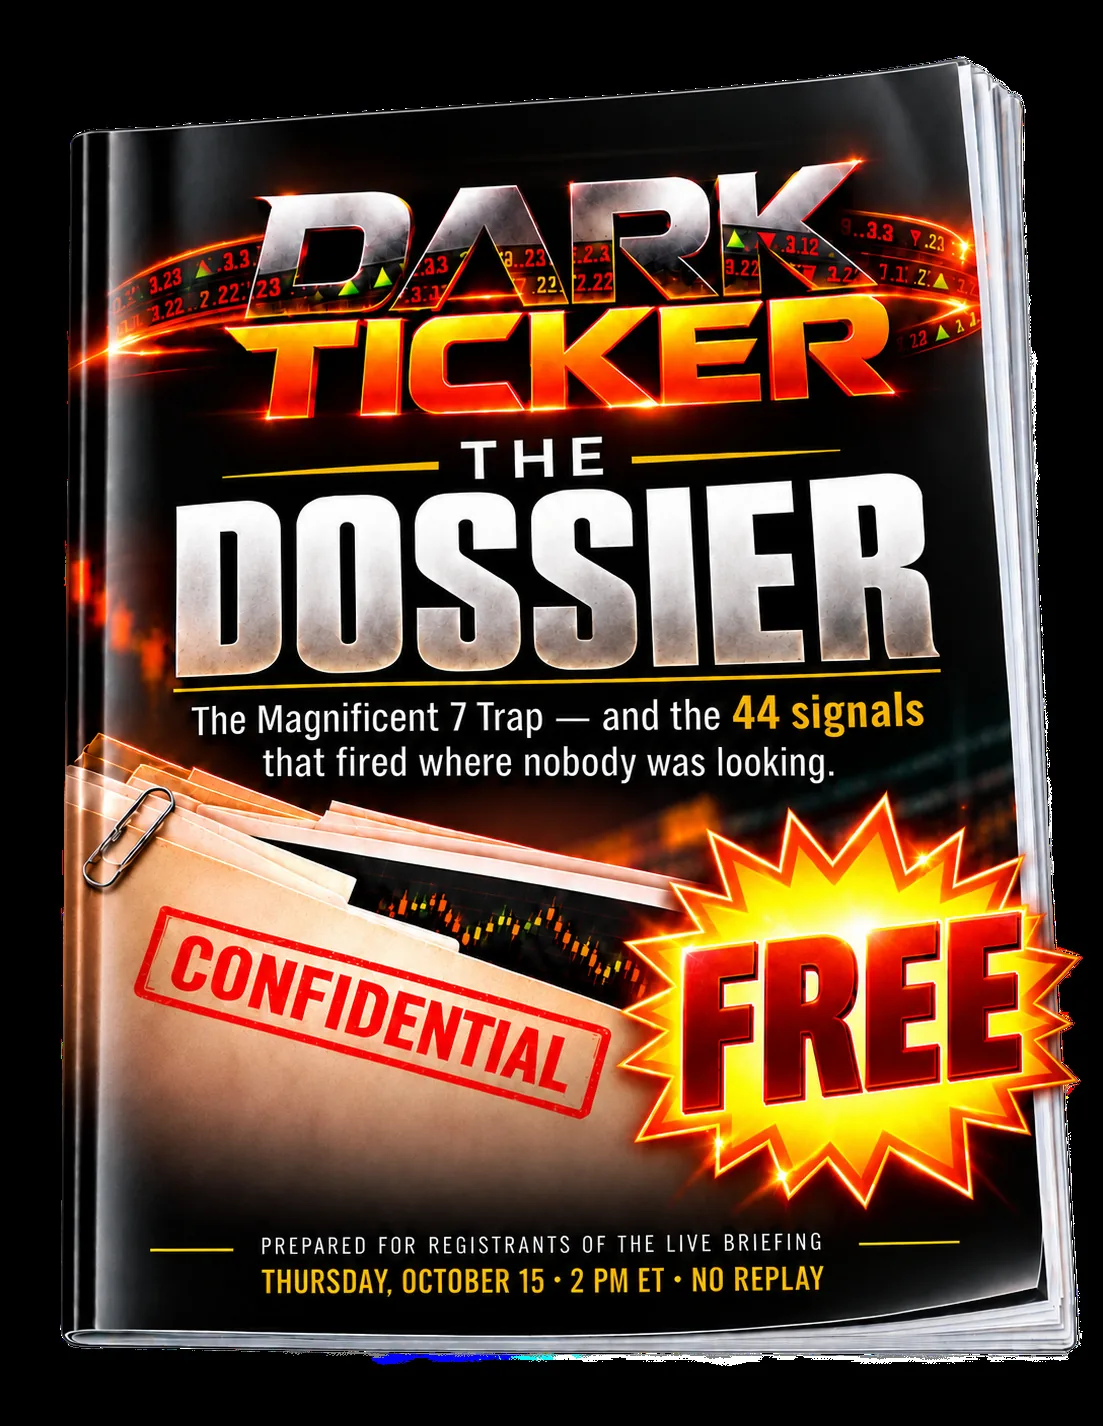
Free the moment you register
Get The Dark Ticker Dossier instantly.
The Magnificent 7 Trap, Jeff’s complete account curve since April, and all 44 signals in order — including every losing trade.
Read it before Thursday. Then come live as Jeff opens what’s still sealed.
There’s a whole other ticker running beneath the headlines.
Turn on CNBC. Open a financial website. Look at what’s trending.
It’s the same handful of stocks, day after day.
Nvidia. Apple. Tesla. Microsoft. Meta.
The stocks everyone watches……and the whole other ticker they’re missing.
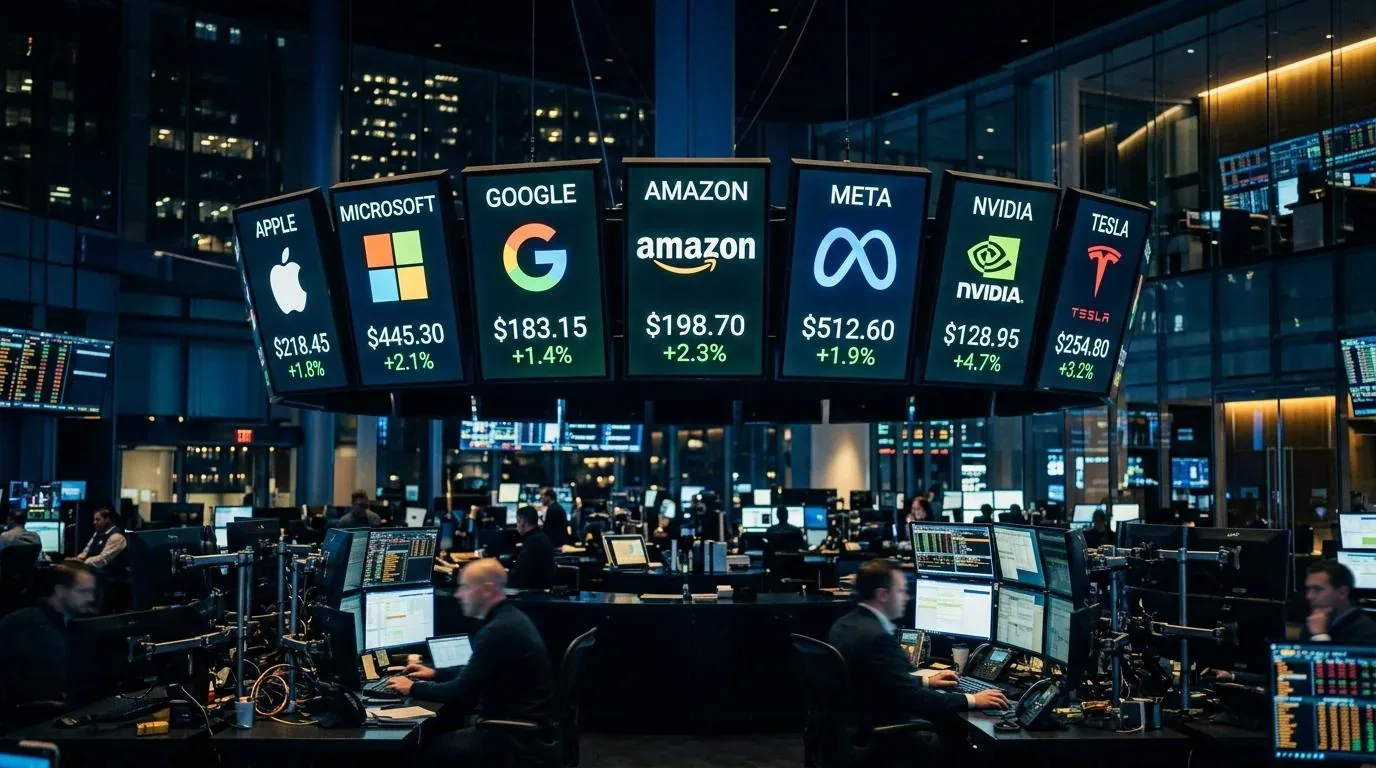
And while everyone’s attention is concentrated on those familiar names, hundreds of other stocks are moving with barely a mention.
That’s where Jeff Bierman has been looking.
Since April, his approach has generated 44 closed trading signals.
Not one was a Magnificent Seven stock.
And on Thursday, he’s opening the entire record.
Every ticker. Every trade. Every winner. Every loser.
So you can see what was happening in the part of the market most traders rarely hear about.
What happened when Jeff followed the Dark Ticker?
Starting with a hypothetical $2,000 account, taking one options contract per closed trade across all 44 signals (45 closed trades)…
And that’s including every losing trade.
- Signal 1, closed Apr 16, winner
- Signal 2, closed Apr 17, winner
- Signal 3, closed May 1, loser
- Signal 4, closed May 7, winner
- Signal 5, closed May 11, winner
- Signal 6, closed May 11, winner
- Signal 7, closed May 11, loser
- Signal 8, closed May 13, winner
- Signal 9, closed May 18, loser
- Signal 10, closed May 18, loser
- Signal 11, closed May 18, winner
- Signal 12, closed May 18, winner
- Signal 13, closed May 19, winner
- Signal 14, closed May 21, loser
- Signal 15, closed May 29, winner
- Signal 16, closed Jun 1, winner
- Signal 17, closed Jun 11, winner
- Signal 18, closed Jun 11, winner
- Signal 19, closed Jun 15, winner
- Signal 20, closed Jun 17, winner
- Signal 21, closed Jun 18, loser
- Signal 22, closed Jul 1, winner
- Signal 23, closed Jul 6, loser
- Signal 24, closed Jul 7, winner
- Signal 25, closed Jul 14, winner
- Signal 26, closed Jul 16, loser
- Signal 27, closed Jul 16, winner
- Signal 28, closed Jul 16, winner
- Signal 29, closed Jul 23, winner
- Signal 30, closed Jul 27, winner
- Signal 31, closed Jul 28, winner
- Signal 32, closed Aug 3, loser
- Signal 33, closed Aug 3, winner
- Signal 34, closed Aug 7, winner
- Signal 35, closed Aug 21, loser
- Signal 36, closed Aug 28, winner
- Signal 37, closed Sep 8, winner
- Signal 38, closed Sep 8, winner
- Signal 39, closed Sep 10, winner
- Signal 40, closed Sep 15, winner
- Signal 41, closed Sep 17, winner
- Signal 42, closed Sep 18, winner
- Signal 43, closed Sep 22, winner
- Signal 44, closed Sep 24, winner
- Signal 45, closed Oct 2, winner
*Hypothetical account starting with $2,000, taking one options contract per closed trade at alert prices on every closed position (the April 14 alert was closed in two halves and counts as two trades) from April 14 to October 2, 2026, primarily defined-risk debit spreads. Peak capital in use at any one time was $1,748. Excludes commissions and slippage. Individual results vary. Past performance does not guarantee future results.
No picking out the three most impressive trades.
No quietly removing the losers.
On Thursday, Jeff is opening the entire record, signal by signal.
You’ll see the actual stocks he identified, the trades that worked, the trades that didn’t, and what he was looking at before making those decisions.
Your registration bonus
Register now and the Dossier is in your inbox before Thursday.
It puts Jeff’s entire record since April in one place — so you can study it before he opens the rest live.
- The Magnificent 7 Trap. Why the most-watched stocks in the world may be keeping your attention in the most crowded part of the market.
- The complete account curve. See the hypothetical $2,000-to-$4,652* record from April through early October — with all 44 signals in order.
- Every one of the ten losing trades. No highlight reel. The losses are named and included right alongside the winners.
- 24 signals still sealed. You’ll see that they exist — but Jeff won’t open those names, the decisions behind them, or the dark ticker he’s watching now until Thursday’s live event.
The Dossier shows you what happened. Twenty-four signals stay blacked out — Jeff opens them live on Thursday, along with what he saw before each trade and the one dark ticker he’s watching right now.
One stock looked ready to move.
Jeff refused to trade it.
On Thursday, he’ll open the actual chart and show you exactly what made him walk away.
Jeff wasn’t simply buying every quiet stock that looked ready to move.
Some stocks appeared promising. He passed on them anyway.
Why?
Because after 38 years studying the markets, Jeff has developed a specific approach to identifying potential moves before they become obvious.
And knowing when not to take a trade is part of that approach.
In fact, there’s one particular chart he’s going to pull up on Thursday. At first glance, it looked like a trade worth taking.
Jeff walked away.
What did he see that made him pass?
He’ll show you the actual chart and explain the decision live. And he’ll do the same with the signals that made it into the record — including the ten that closed at a loss.
Before you register
What Thursday is not.
It’s not another take on Nvidia, Apple or Tesla. We’re not covering the seven at all. You can get that on any channel, any day.
It’s not a highlight reel. You won’t just see the three best trades. The ten losses are part of the record, and Jeff goes through those too.
It’s not a “buy this tomorrow” tip. Jeff will share one stock he’s watching — but the point is seeing why it has his attention, not being handed a ticker.
It’s not a news recap. No reacting to every headline or guessing what the Fed does next.
It’s not a “quit your job” pitch. Nobody’s promising you overnight money. Trading involves risk, and Jeff will show you the losing signals right alongside the winners.
You don’t need to be a chart expert. Jeff walks through every chart on screen, so you can follow along even if you’ve never looked at a stock like this before.
Here’s what you will get instead ↓
On Thursday, Jeff is opening the Dark Ticker.
For this special presentation, you’ll get to see:
- 1
The complete 44-signal record
Every ticker. Every winner. All ten losses. The actual trading record from April through September.
- 2
What Jeff saw before the moves
He’ll open the charts and walk you through the decisions behind the signals — including stocks he deliberately passed on.
- 3
One dark ticker he’s watching right now
This isn’t just a look at what happened months ago. Jeff will reveal one stock currently on his watchlist, show you its chart, and explain exactly why it has his attention. You’ll see the ticker revealed live.
Thursday, October 15 · 2 PM ET · No replay
Bonus for live attendees: show up live and you could win $1,000 cash. No purchase necessary; must attend live to win. Official rules.

Meet the man behind the Dark Ticker.
Professor Jeff Bierman, CMT
Former Chief Market Technician at TD Ameritrade.
Jeff’s 38-year market career has taken him from Nasdaq market making to hedge-fund trading, eight years as Chief Market Technician at TD Ameritrade, work on thinkorswim, and graduate-level finance teaching at Loyola and DePaul.
He’s also appeared on CNBC, Bloomberg and Yahoo Finance.
He’s spent his career studying how stocks behave — particularly what their charts can reveal before significant price moves.
On Thursday, he’s opening his record and showing you what he’s been seeing.
The Dark Ticker comes to light Thursday.
44 closed signals. The winners. The losers. The stocks the financial headlines overlooked.
And one stock Jeff is watching right now.